Cerrado Precipitation & Vegetation
4 min read · Last updated 1 October 2026
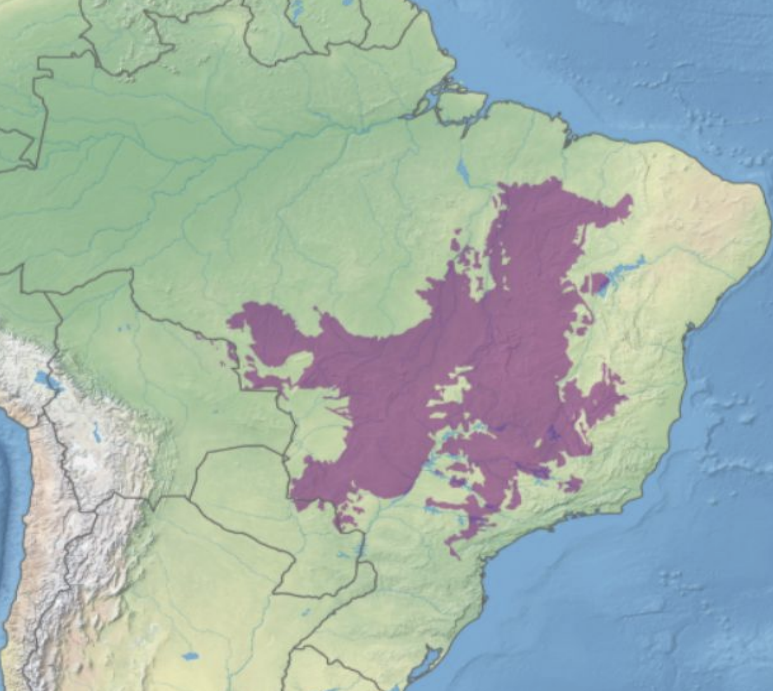
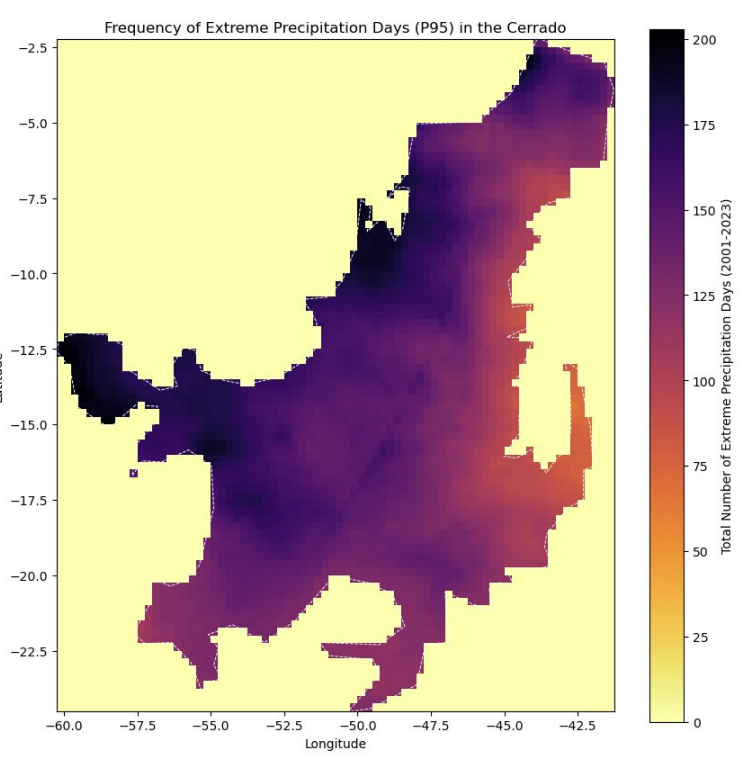
The Cerrado, Brazil's vast tropical savanna and one of Earth's most species-rich biomes, has lost nearly half its original extent to agricultural expansion over the past five decades. Beyond the direct ecological consequences, rapid land-cover change raises a second-order question of considerable scientific interest: to what extent does the removal of vegetation alter the regional precipitation regime? Scientific evidence suggests that vegetation loss can disrupt moisture recycling and modify atmospheric circulation, potentially intensifying or suppressing local rainfall. This project investigates the empirical basis for that coupling, asking whether observed changes in precipitation frequency across the Cerrado between 2001 and 2024 are spatially and temporally associated with changes in vegetation health.
Overview
Does vegetation health in Brazil's Cerrado respond to precipitation immediately, or with a lagged delay? The answer has direct implications for how ecosystem recovery is modelled following drought or land-use disturbance.
Background
Empirical studies systematically linking precipitation change to spatial patterns of vegetation health remain limited, despite the Cerrado experiencing both rising extreme rainfall events and rapid forest loss over the past 20 years. The hypothesis here was that a decrease in precipitation frequency between 2001 and 2024 would show a strong positive spatial correlation with a decline in vegetation health, but the temporal structure of that relationship, whether immediate or lagged, was an open empirical question.
Methodology
Data Sources
Approach
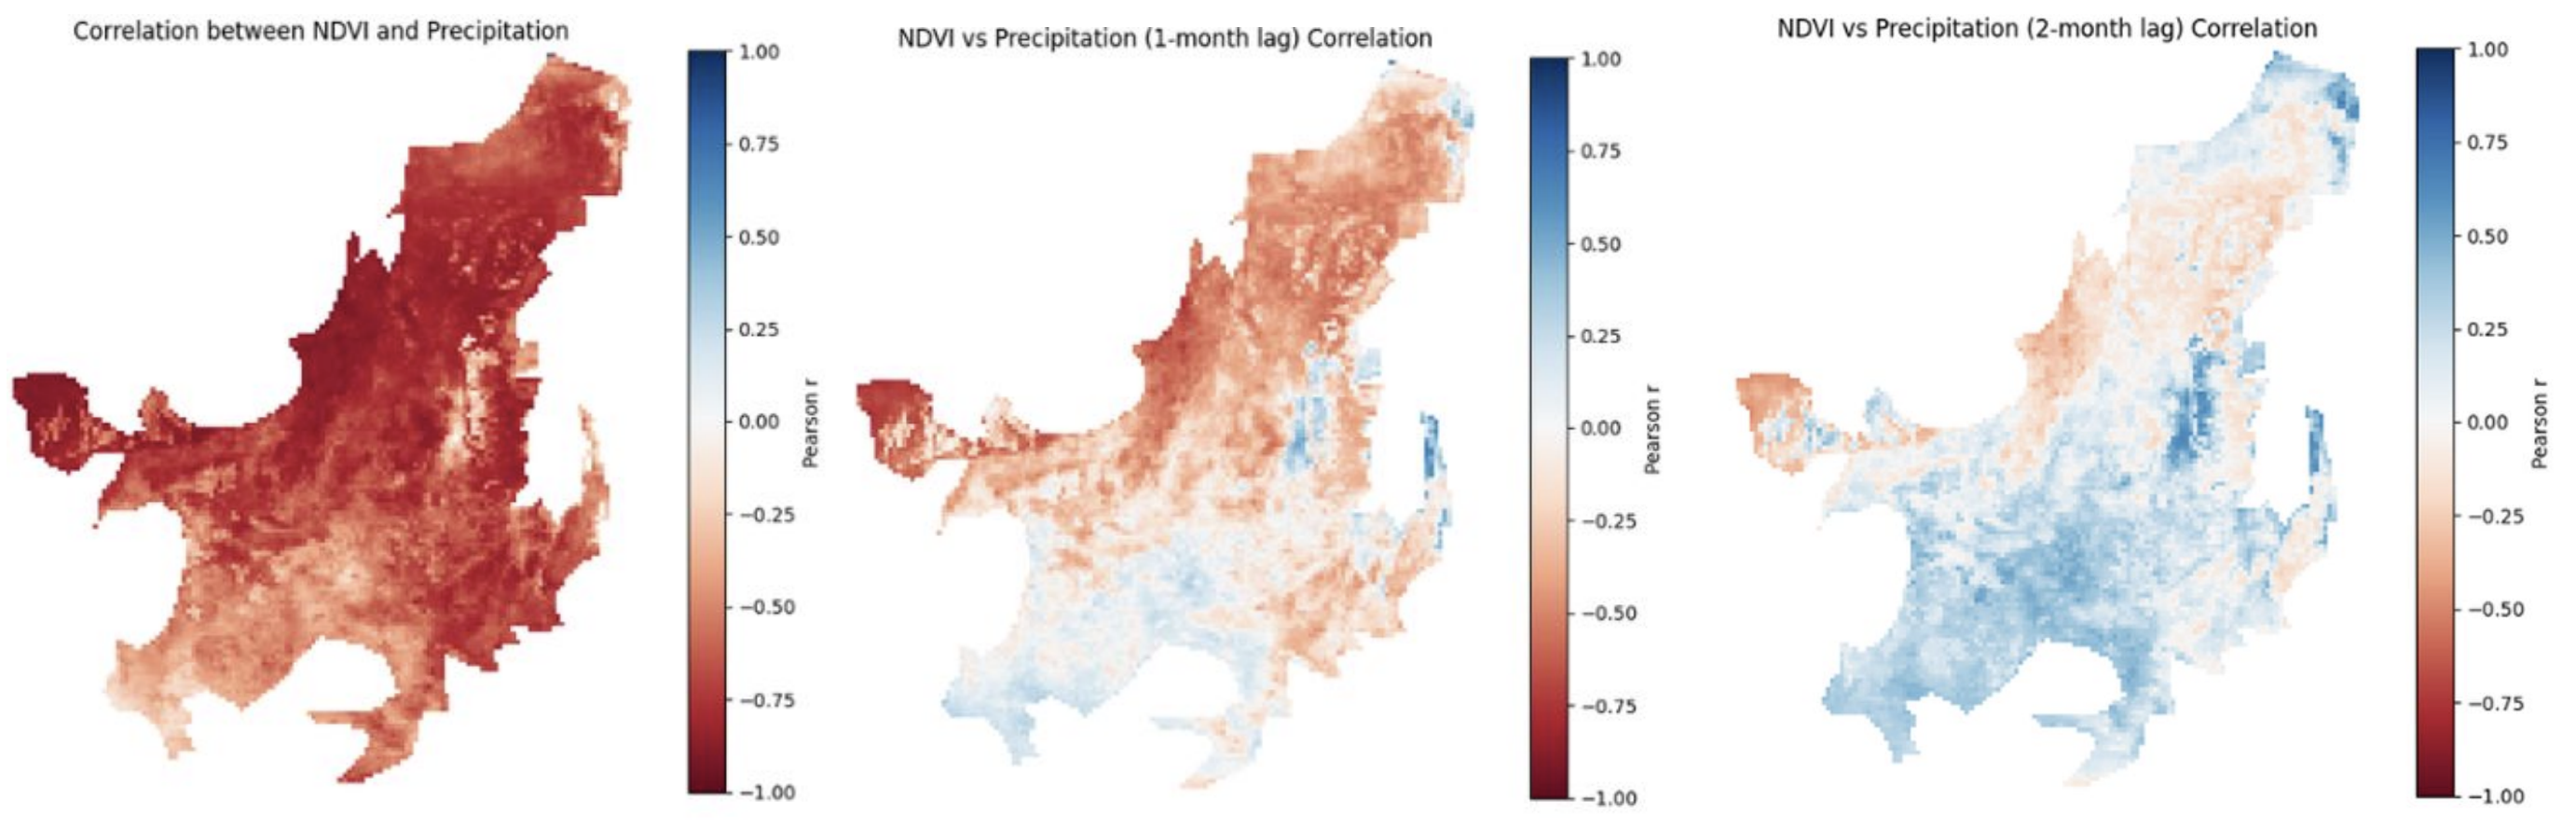
Monthly precipitation totals from CHIRPS v2.0 (a satellite-gauge blended reanalysis at 0.25° resolution) were paired with monthly mean NDVI derived from MODIS MOD09GA surface reflectance, both clipped to the Cerrado biome boundary. A per-pixel lag-correlation analysis was performed at lags of 0–4 months, characterising the delayed vegetation response to antecedent rainfall across the full spatial extent of the biome and the 288-month study period.
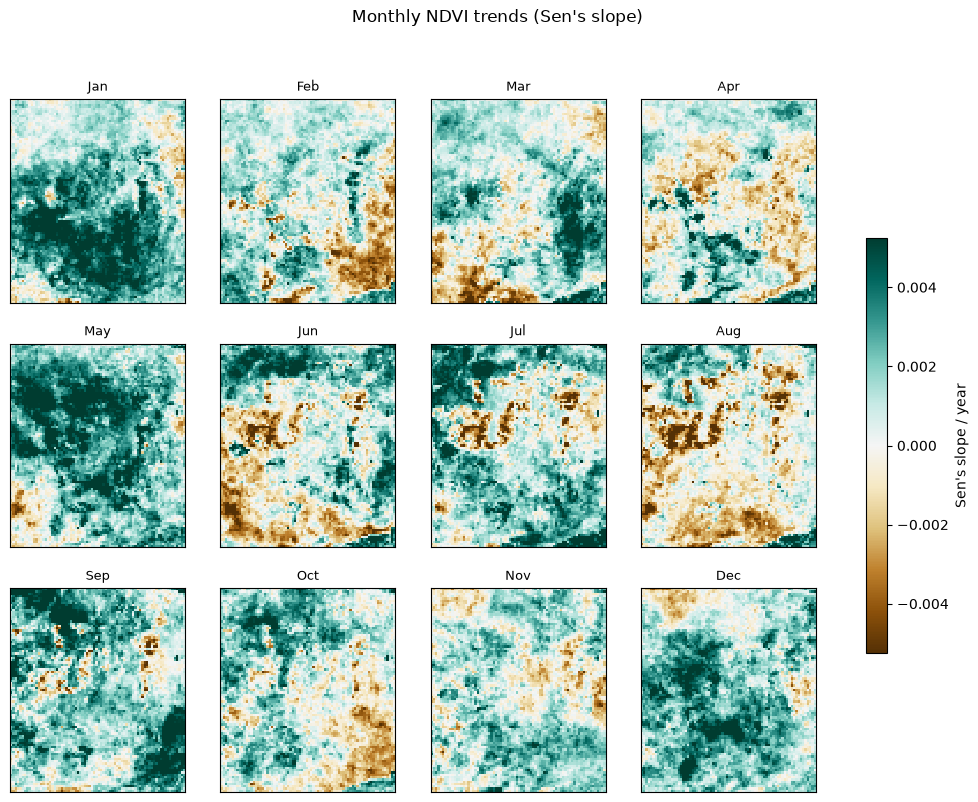
Sen's slope, a non-parametric, outlier-robust trend estimator, was applied independently for each calendar month and each pixel, separating the long-term directional signal from the dominant seasonal cycle. This approach allows direct comparison of where and when each variable is changing most rapidly, without confounding wet-season and dry-season dynamics.
Limitations
- Grid alignment is approximate. CHIRPS (native 0.25°) and the NDVI export (~25 km scale) don't share grid points, so NDVI is interpolated onto the CHIRPS grid rather than truly co-located.
- NDVI is computed from MOD09GA surface reflectance, not the standard pre-built MOD13Q1 product, and therefore lacks built-in cloud and quality-flag masking; residual atmospheric contamination may affect individual months.
- Google Earth Engine's per-request payload limit required the Cerrado boundary geometry to be simplified before use as a clip mask, introducing minor boundary imprecision at coarse export scales.
Results
Vegetation greenness in the Cerrado is driven by stored soil moisture rather than concurrent precipitation. The strongest NDVI response to a rainfall event is observed 3–4 months later - a lag that must be accounted for when modelling ecosystem recovery following drought or disturbance.
The lag-correlation analysis reveals a consistent and spatially coherent pattern: the instantaneous correlation between monthly precipitation and NDVI is weakly negative across much of the biome, in part because high-rainfall events coincide with cloud cover that attenuates the satellite reflectance signal. The strongest positive correlations emerge at lags of 3–4 months, indicating that vegetation greenness responds primarily to accumulated antecedent soil moisture rather than to concurrent rainfall.
Trend analysis shows that wet-season months (January–May) exhibit widespread positive NDVI trends across the biome over the study period, while the dry season (June–September) reveals a spatially heterogeneous mix of browning and greening. This decoupling between precipitation trends and vegetation trends in the dry season suggests that land-use dynamics and localised soil-moisture feedbacks are increasingly mediating the vegetation response, independent of regional rainfall signals.
What I Learned
The original Colab notebooks referenced a precipitation source that turned out not to exist as a public bucket. Rebuilding stage 1 meant finding the official CHIRPS distribution and substituting it. The same rebuild also surfaced a second, more dangerous bug: the original latitude slice assumed descending order, but CHIRPS stores latitude ascending. This fails silently (an empty array, no error) rather than crashing, the kind of bug that is easy to ship without noticing.
On the Earth Engine side, exporting NDVI clipped to the full-resolution Cerrado state-boundary shapefile exceeded Earth Engine's 10 MB request-size limit. Simplifying the polygon's vertex count before using it as a clip mask fixed it, and dropping the export scale to ~25 km made the full 288-month pull tractable instead of hitting rate limits.